¶ RM MONITORING via INFLUXDB & GRAFANA
Store sensors data in InfluxDB data base and visualize the data in Grafana.
Compatible with Controller firmware version 37.1 or newer.
¶ SENSORS
| SENSOR | DESCRIPTION |
|---|---|
| V | Cooling system power sensor |
| T0 | STM thermal sensor |
| T1 | Coolant inlet temperature sensor |
| T2 | Coolant outlet temperature sensor |
| T3 | Air inlet temperature sensor |
| T4 | Air outlet temperature sensor |
| T5 | I2C thermal and humidity sensor placed on the controller board |
| T6 | I2C thermal sensor for pumps and fans |
| F1..F6 | Fans sensor |
| P1..P2 | Pumps sensor |
| FLOW | Flow meter |
| RH | Humidity sensor placed on the controller board (starting Controller version 38.3) |
| LEVEL | Coolant level sensor |
| PRESSURE | Pressure sensor |
¶ 1. Install InfluxDB data base
Download the application for your OS.
- Windows: https://dl.influxdata.com/influxdb/releases/influxdb2-2.1.1-windows-amd64.zip
- Linux: https://dl.influxdata.com/influxdb/releases/influxdb2-2.1.1-linux-arm64.tar.gz
¶ Windows
- Expand archive to C:\Program Files\InfluxData\influxdb\
- In Powershell, navigate into C:\Program Files\InfluxData\influxdb and start InfluxDB by running the command:
> cd -Path 'C:\Program Files\InfluxData\influxdb'> ./influxd
¶ Ubuntu
1. Run the command:
> sudo dpkg -i influxdb2-2.1.1-xxx.deb
2. Start the InfluxDB service:
> sudo service influxdb star
¶ 2. Configure InfluxDB
- Open the browser and go to http://localhost:8086/. InfluxDB web interface will open.
- Setup the user by adding username, password, organization unit (e.g. Comino) and initial bucket (e.g. CominoBucket). Click Continue.
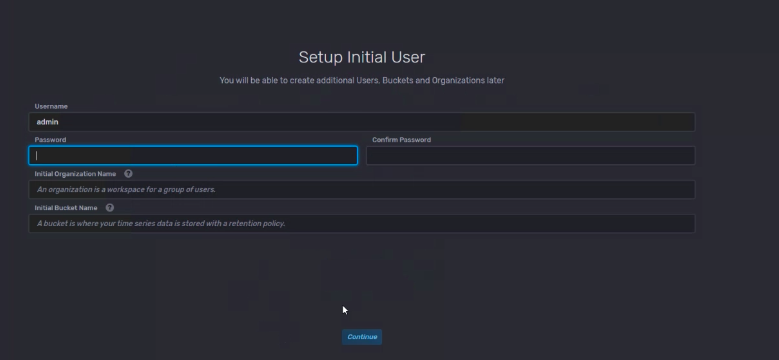
- Choose Quick Start
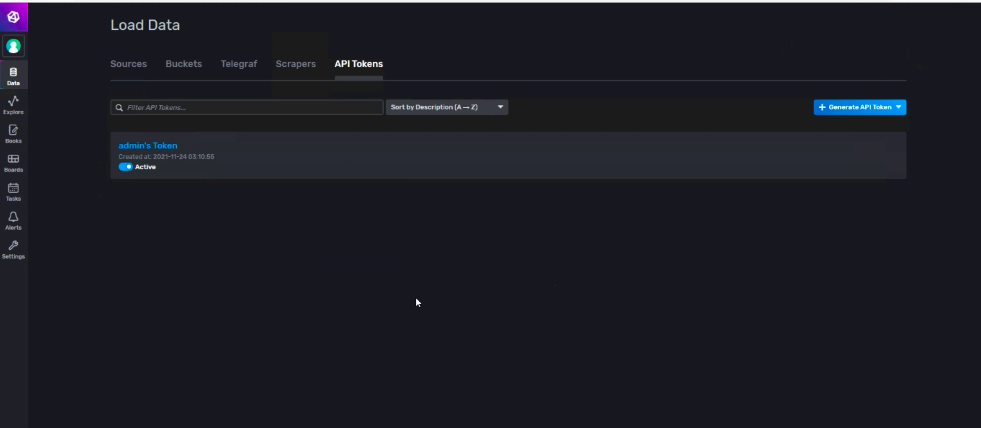
- Get your token. Go to Data → API Tokens. Click on admin's Token, copy the token and save it, you will need to add it to the config file later.
¶ 3. Install Comino Utility
Download the utility for your OS.
- Windows: http://dl-comino.s3.amazonaws.com/downloads/RM_Monitoring_Utility_v3_Windows.zip
- Linux: http://dl-comino.s3.amazonaws.com/downloads/RM_Monitoring_Utility_v3_Linux.zip
¶ Windows Installation
- Run comino-setup.exe
- Go through setup wizard
- At the first start of the Utility, allow access to the network
¶ Ubuntu Installation
- Open terminal and go to the folder where you downloaded the file
- Install it with command:
> sudo dpkg -i comino-api.deb
3. After installation check comino-api.service:
> sudo systemctl status comino-api.service
- On successful installation, you will see data from sensors at http://localhost:20000/sensors
- Go to Task Manager and end Comino-Noconsole task
¶ 4. Configure Comino Utility
- Open /etc/rm-monitor/rm-monitor.yml in a text manager. Add there AuthToken and OrganizationName, that you've copied from InfluxDB. Save the file.
SerialPort:
Name: auto (Do not edit, this is controller virtual port))
Request
PeriodSecs: 5 (Controller polling time in seconds)
HttpServer:
Address: localhost (Address at which the api will be available)
Port: 20000 (Port at which the api will be available)
InfluxDB:
BucketName: <add here device name, e.g. “MyRM”. If device name is not set, then the Controller ID is taken>
ServerURL: http://localhost:8086
AuthToken: <paste here token you've copied from InfluxDB>
OrganizationName: <paste here organization name from InfluxDB>
- Restart comino-api application
¶ Windows
StartMenu → Comino-api → comino-noconsole.exe
¶ Ubuntu
> sudo system ctl restart comino-api.service
¶ 5. Get Data in InfluxDB
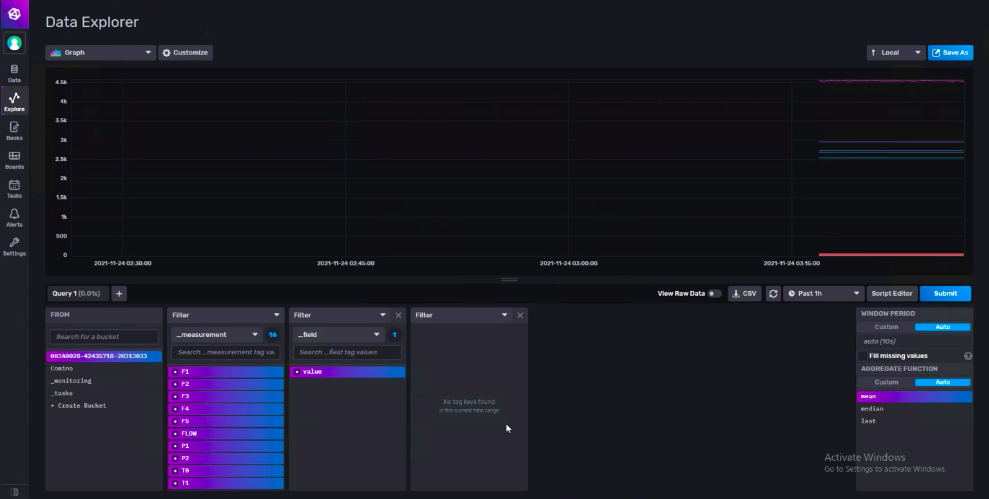
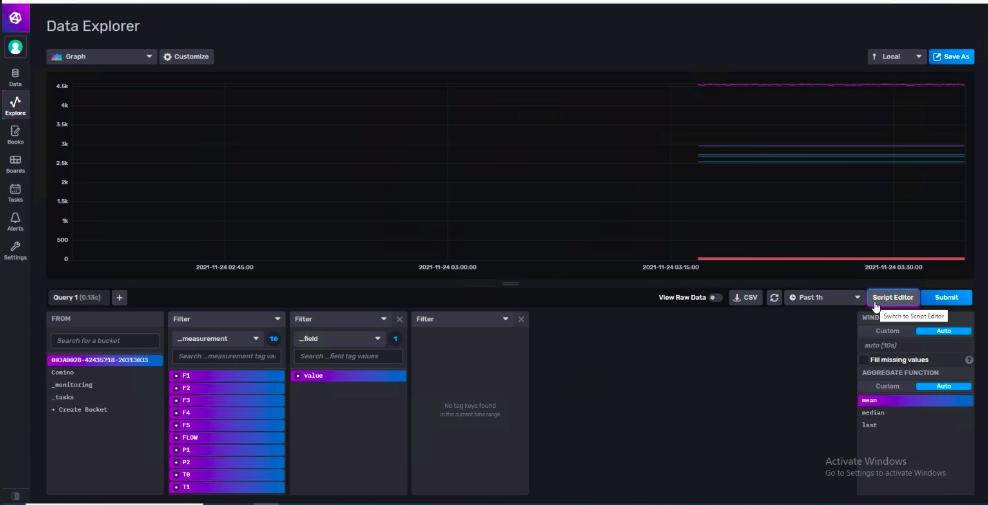
- Go to InfluxDB → Explore.
- Check that you see a new bucket in the bucket list, that looks like XXXXXXXX-XXXXXXXX-XXXXXXXX. Click on it.
- Choose _measument from the dropdown menu and choose all the sensors.
- In the column on the right choose _filter from the dropdown menu and choose value.
- Click Submit. You should see the graph.
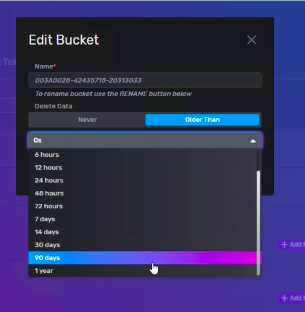
- Set clearing data. Go to Data → Choose the necessary Bucket → Settings → Older than. Choose the appropriate period for storing the data (we suggest 90 days) and click Save.
¶ 6. Install Grafana
Download the application for your OS.
- Windows: https://dl.grafana.com/enterprise/release/grafana-enterprise-8.2.5.windows-amd64.msi
- Ubuntu: https://dl.grafana.com/enterprise/release/grafana-enterprise_8.2.5_amd64.deb
- Open the browser and go to http://localhost:3000. Grafana web interface will open.
- Set up password and go inside.
¶ 7. Configure Grafana
- Open side menu (click the Grafana icon in top menu) head to Data Sources and add your data source.
- Go to CONFIGURATION -> Data Source -> Add Data Source
- Choose InfluxDB
- Add Name, if necessary
- In Query Language choose Flux
- Add URL - http://localhost:8086
- Turn off basic auth
- Add Organization & token (preliminary configured in InfluxDB)
- Add Bucket (e.g. CominoBucket)
- Click Save&Test
- In side menu go to Dashboards → Manage → New Dashboard
- Add an empty panel
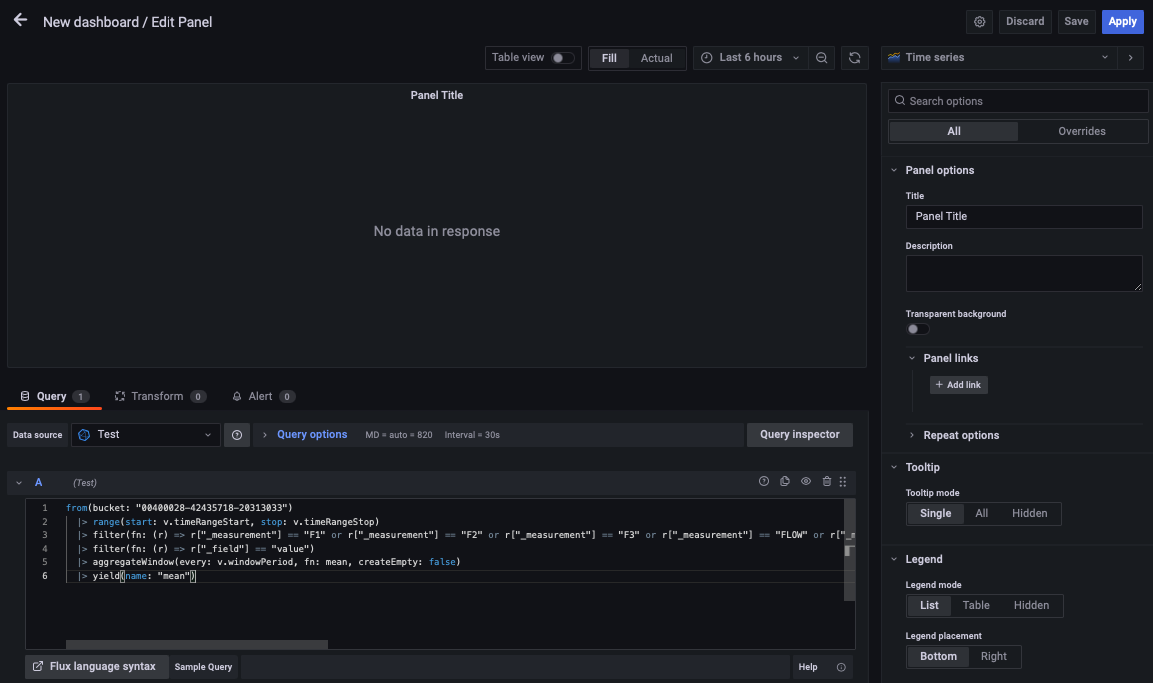
- Paste the script you've copied from InfluxDB in the Query panel. Click Apply.
- You should see the graph with all the data from RM machine controller.
