¶ RM MONITORING, Version 1.0.8
This version combines the advantages of previous versions and lets the user establish monitoring via REST API, or pushing data into cloud InfluxDB, or storing data in a local data base, or … all in once – using the same installer.
¶ Technical Requirements
OS: Windows 10 / Ubuntu 18.04
Hard disk drive: 292MB
Controller firmware version 37.1 or newer
¶ Downloads
¶ Installation Package
- SQLite (database engine)
- Grafana (monitoring & analytics application)
¶ Installation Steps for Windows OS
- Double click on the executable to start installation.
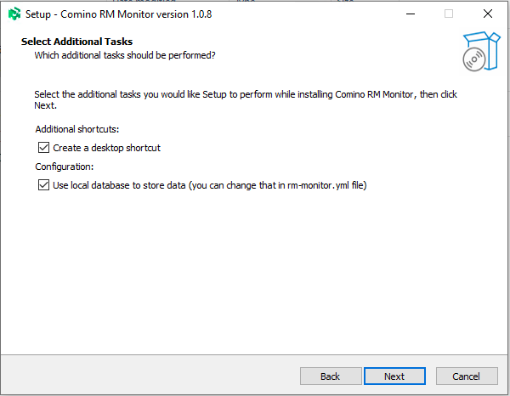
- Check the checkbox if you want to use local database

¶ Using Configuration File
Shortcut to Configuration file is available from Start Menu -> Comino -> rm-monitor.yml. Open the file in the notepad application.
SerialPort:
Name: auto (Do not edit, this is controller virtual port)
RequestPeriodSecs: 5 (Controller polling time in seconds)
InternalDB:
Enabled: true (change to FALSE if you do not need local data base)
RetentionPeriodDays: 120 (how long the local data base stores data)
HttpServer:
Address: localhost (Address at which the api will be available)
Port: 20000 (Port at which the api will be available)
InfluxDB:
Enabled: true
BucketName: rm-monitor-bucket
ServerURL: http://localhost:8086
AuthToken: <paste here token you've copied from InfluxDB>
OrganizationName: default-org <paste here organization name from InfluxDB>
¶ Using Grafana Interface
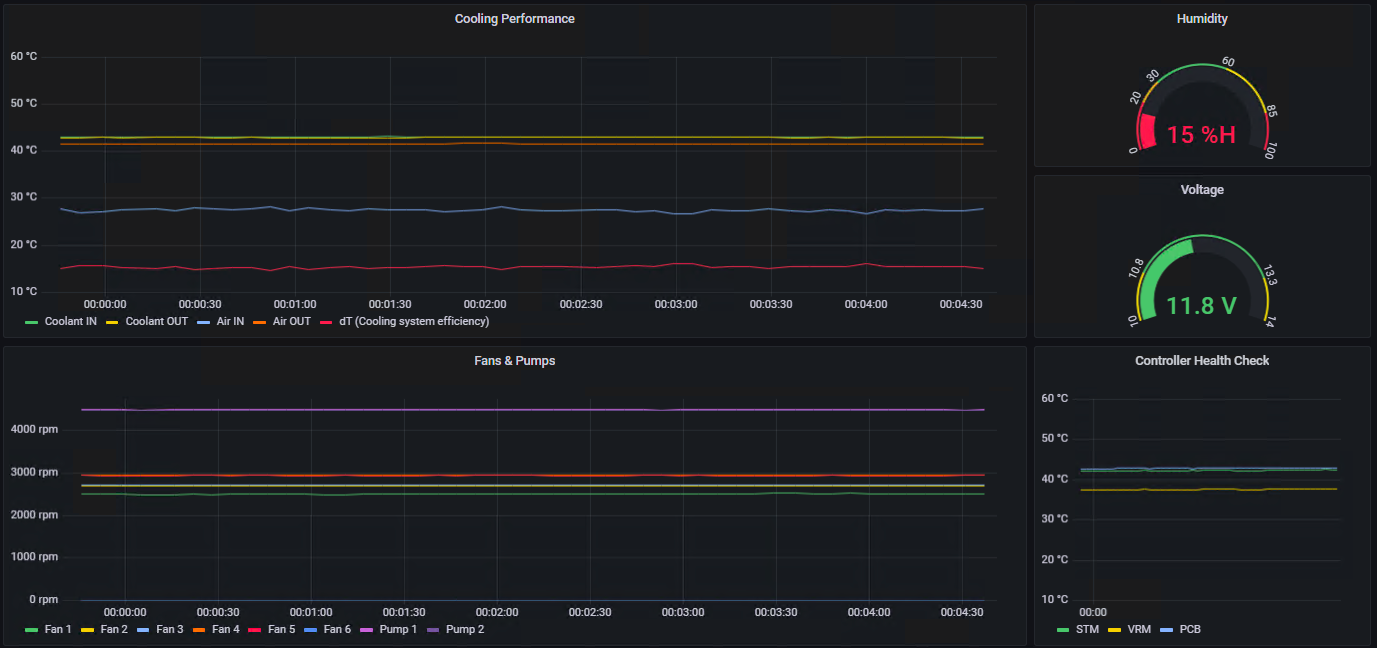
To use local Grafana interface, click on RM Monitor shortcut in Start Menu -> Comino -> Open RM Monitor or proceed to http://localhost:3000/d/-GhXmAY7k/rm

¶ Cooling Performance Panel
Shows Air and Coolant inlet & outlet temperatures and calculated coolant system efficiency
¶ Humidity
Shows humidity on the controller PCB
¶ Voltage
Shows voltage
¶ Fans & Pumps
Shows number of rotation per minute for each fan & pump
¶ Controller Health Check
Shows VRM, STM and PCB health
¶ Using REST API
To get sensors data via URL through Rest API proceed to http://localhost:20000/sensors
Check the table with SENSORS for more details
¶ DNAT
Before connecting to the monitoring system make sure that both your RM machine and the monitoring system are in the same network, i.e. if you’re using the monitoring system in your local network, then you can start connecting. Otherwise, you need to translate the destination IP address of the internal server to public IP address (DNAT).
¶ Using cloud InfluxDB
To connect to cloud InfluxDB paste server url, authentication token and organization name into the configuration file.
¶ Suggested Monitoring Alerts
OK – everything is OK, no notifications or alarms
Warning – warning, approaching to the critical threshold
Critical –critical error, the controller turns everything off, the start is blocked until the temperature returns to the green zone
| Sensor Name | Critical | Warning | OK | Warning | Critical | |
|---|---|---|---|---|---|---|
| STM | T0 | ..-20 |
-19..0 |
1..74 |
75..77 |
78.. |
| CLNT IN | T1 | ..1 |
2..3 |
4..57 |
58..59 |
60.. |
| CLNT OUT | T2 | ..1 |
2..3 |
4..57 |
58..59 |
60.. |
| AIR IN | T3 | ..1 |
2..3 |
4..34 |
35..37 |
38.. |
| AIR OUT | T4 | ..1 |
2..3 |
4..59 |
60..64 |
65.. |
| VRM | T5 | ..-20 |
-19..0 |
1..89 |
90..104 |
105.. |
| PCB | T6 | ..-20 |
-19..0 |
1..99 |
100..117 |
118.. |
| HUMIDITY | RH | 0..19 |
20..29 |
30..59 |
60..85 |
86..100 |
| VOLTAGE 12V | V | ..10.7 |
10.8..13.2 |
13.3.. |
||
* all values in the table are temperatures in Celsius